Name of the participant: Thomas Reschenhofer
Description of the IT-research project: In almost all enterprises of today the available information quantity is not only subject to an enormous growth, but also to an increasing networking of their information objects. The analysis of this ever larger and more complex information quantity becomes therefore a central challenge. The analyses of different user groups at different times must be supported simultaneously. To meet this challenge, desktop tools such as Microsoft Excel – commonly referred to as spreadsheets – are used in practice to enable end users to independently and interactively aggregate and visualize flat data sets (sales, costs, etc.). Their fields of application range from inventory management to financial reporting. A very important aspect of the paradigm is to hide the design of the spreadsheet from the user, since the user does not have to explicitly model his application. The design of the spreadsheet is determined implicitly by the definition of calculations (e.g. sums across columns) and visualizations (e.g. pie charts, time series, etc.). Although hiding the spreadsheet design results in a high degree of flexibility, the intransparency of the resulting dependencies makes it difficult to trace the effects of a change. For example, it is not obvious which visualizations or calculations are dependent on a particular cell, especially if dependencies exist across several cells. Because of this uncertainty, the creation of a new spreadsheet and thus the creation of redundancies is usually preferred to the modification of individual calculations.
This is particularly true when spreadsheets are exchanged between business users and changes are made to third-party spreadsheets. Visualizing the dependencies of a spreadsheet, on the other hand, would support the user in evaluating the effects of a change. Furthermore, spreadsheets like Excel focus on calculations based on two-dimensional structures such as time series and tables. Each individual cell of such a structure contains a simple object, such as a number, a date, or simple text. Complex structured and networked objects cannot be displayed in the cells of a spreadsheet. This restriction means that calculations with complex intermediate results or outputs are not possible in classic spreadsheets.
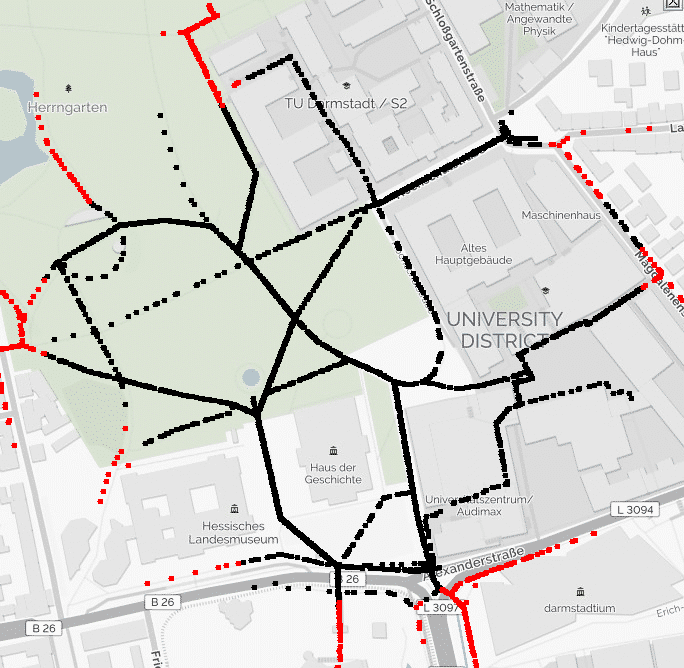
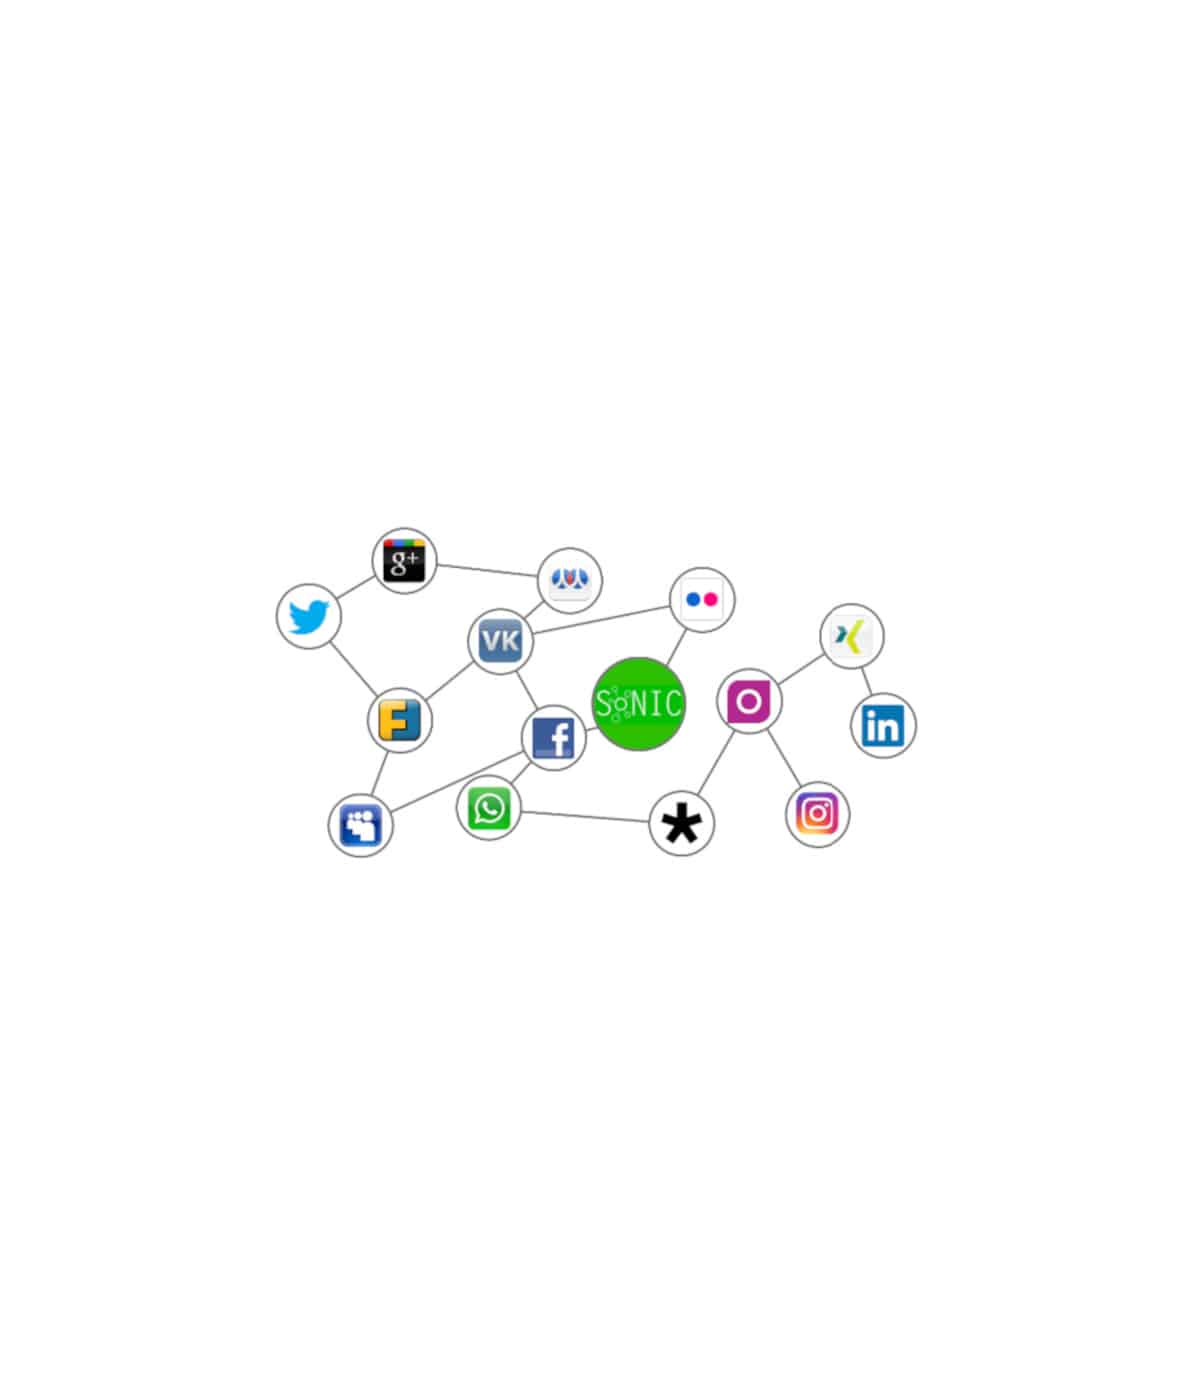
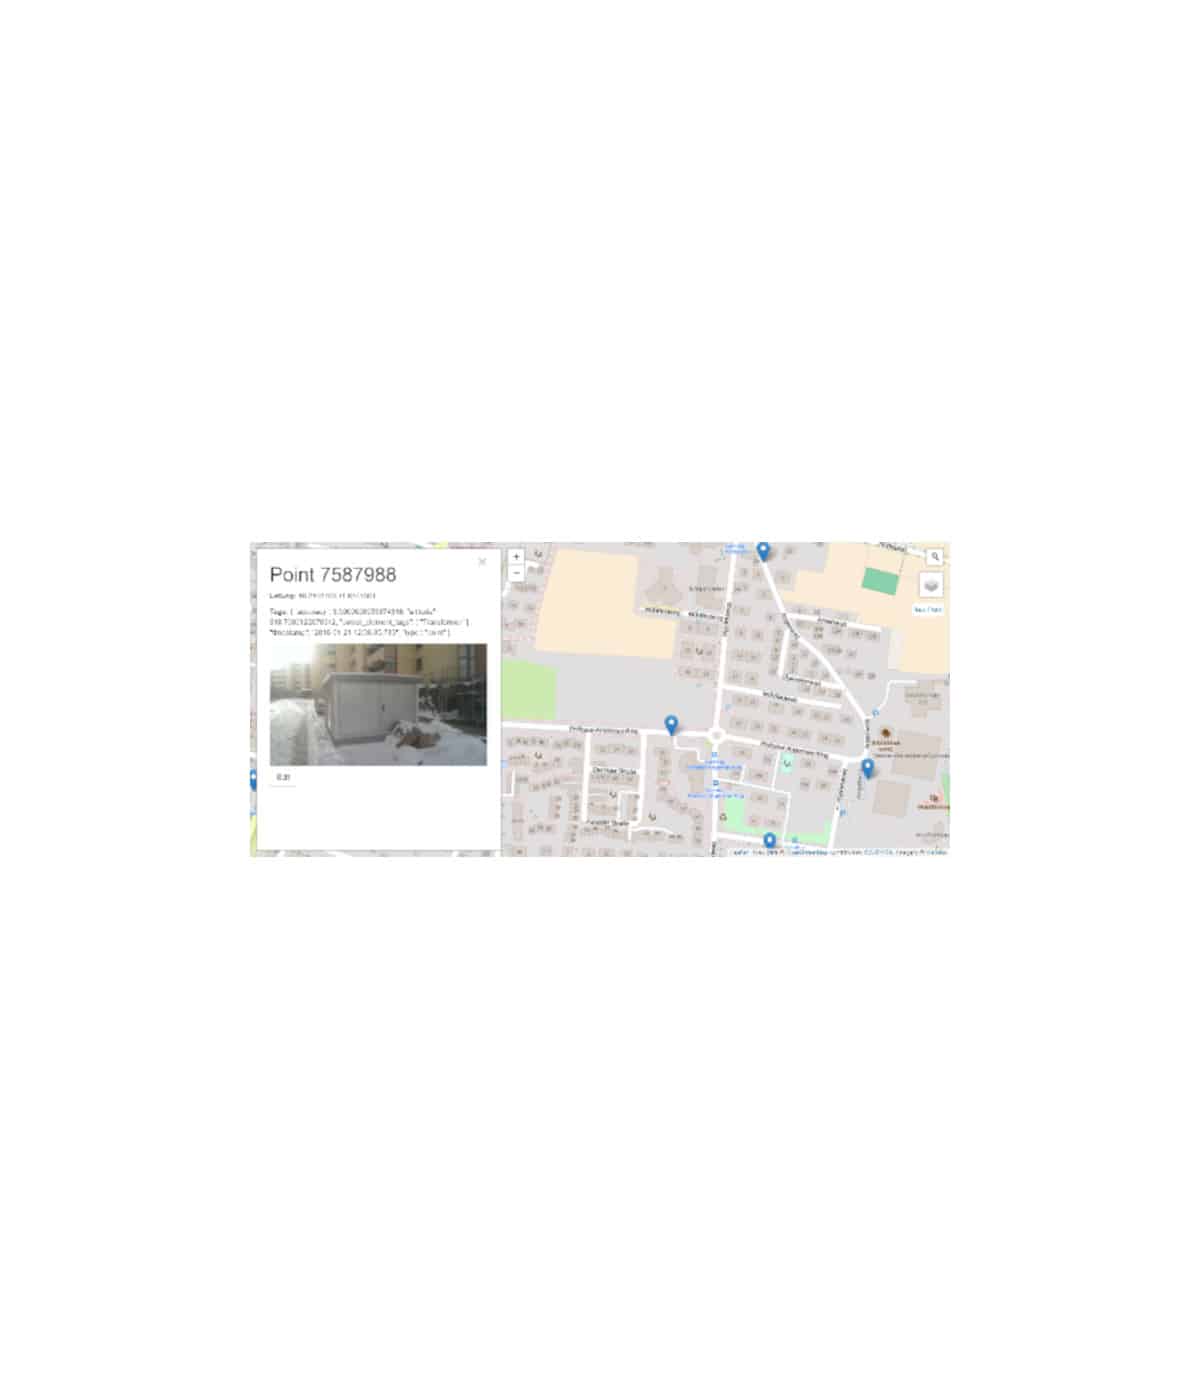
An example of complex structured and networked objects are tree structures. It is very difficult to analyze a tree structure of any depth with a spreadsheet specialized in simple objects. An example of complex networked data are network-like structures, e.g. social networks and logistics networks. Questions such as “Which location is best suited as a central hub due to its accessibility” can either not be answered at all or only with great difficulty in conventional spreadsheets.
Complex networked structures can be represented in the form of one or more tables (e.g. one table each for nodes and edges of a graph). However, due to the restriction of spreadsheet cells to simple result types, these complex meshed structures cannot be the result of a calculation.
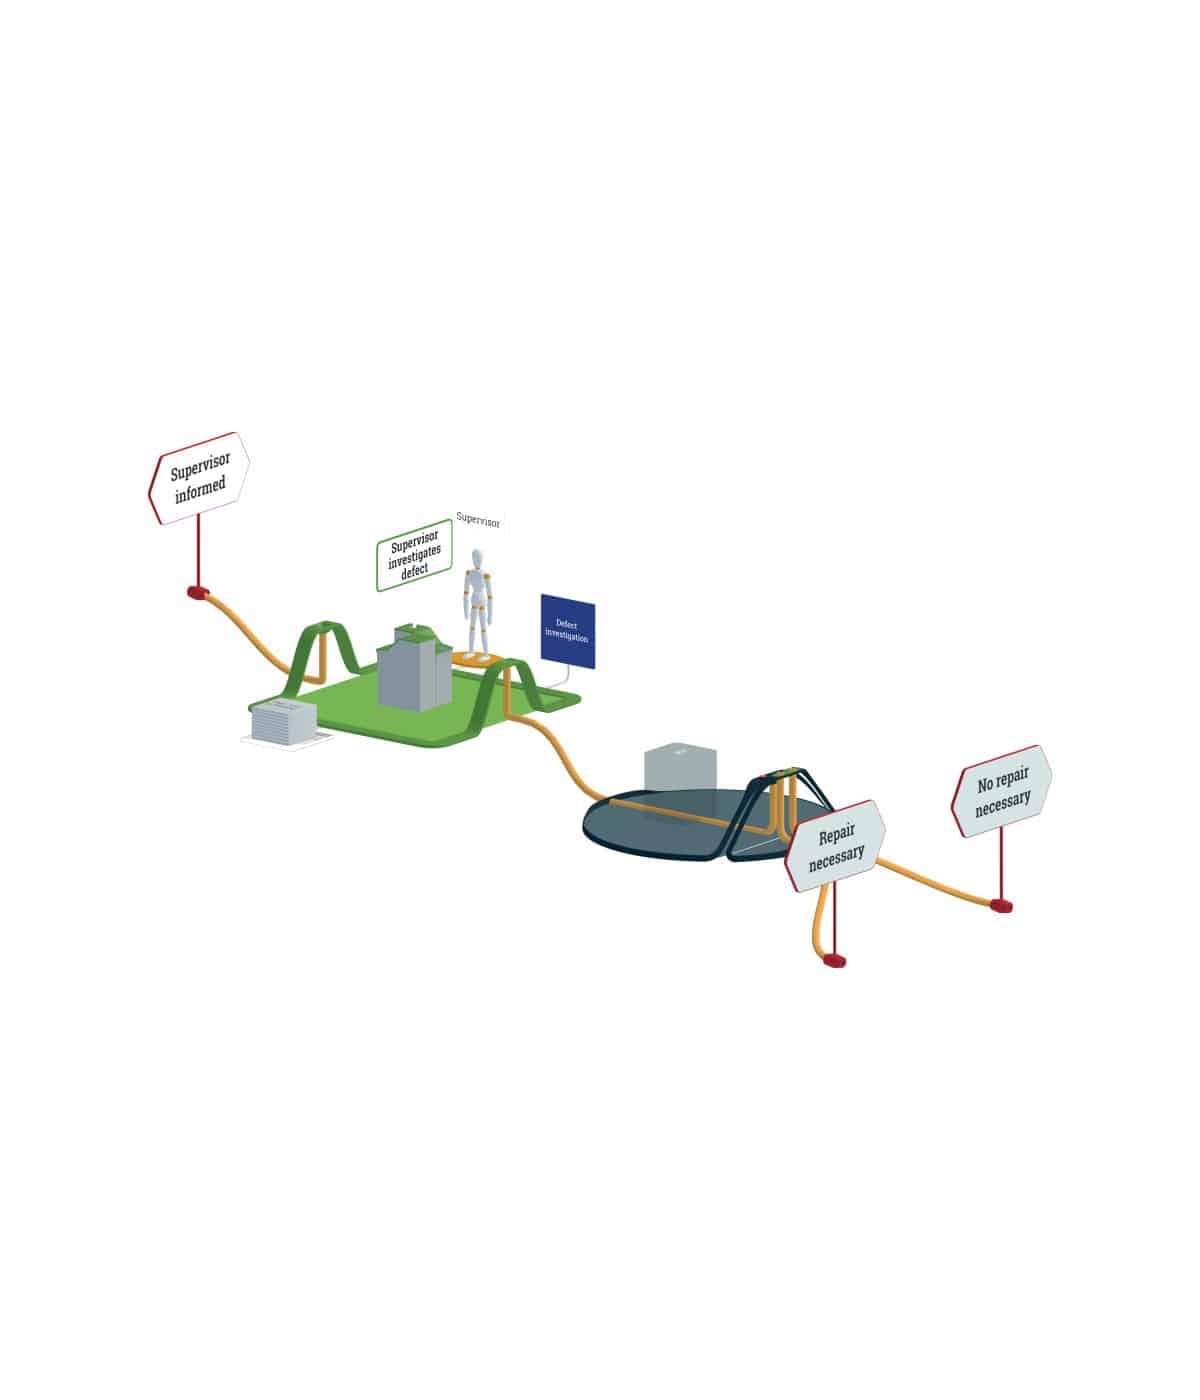
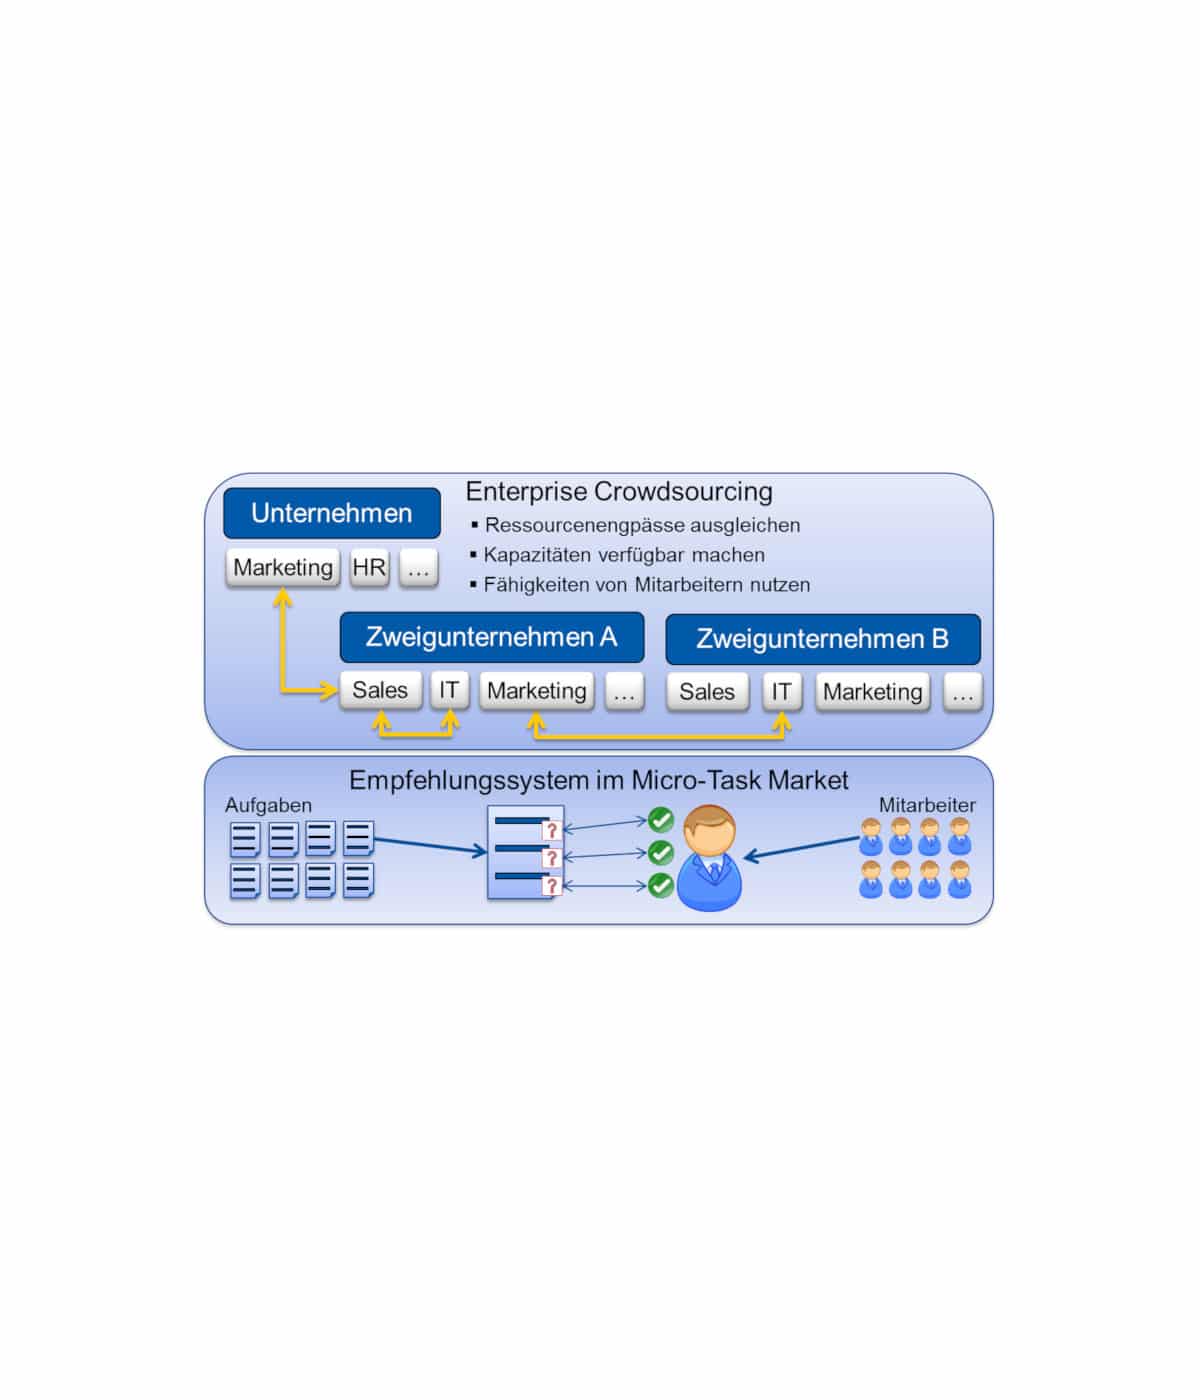
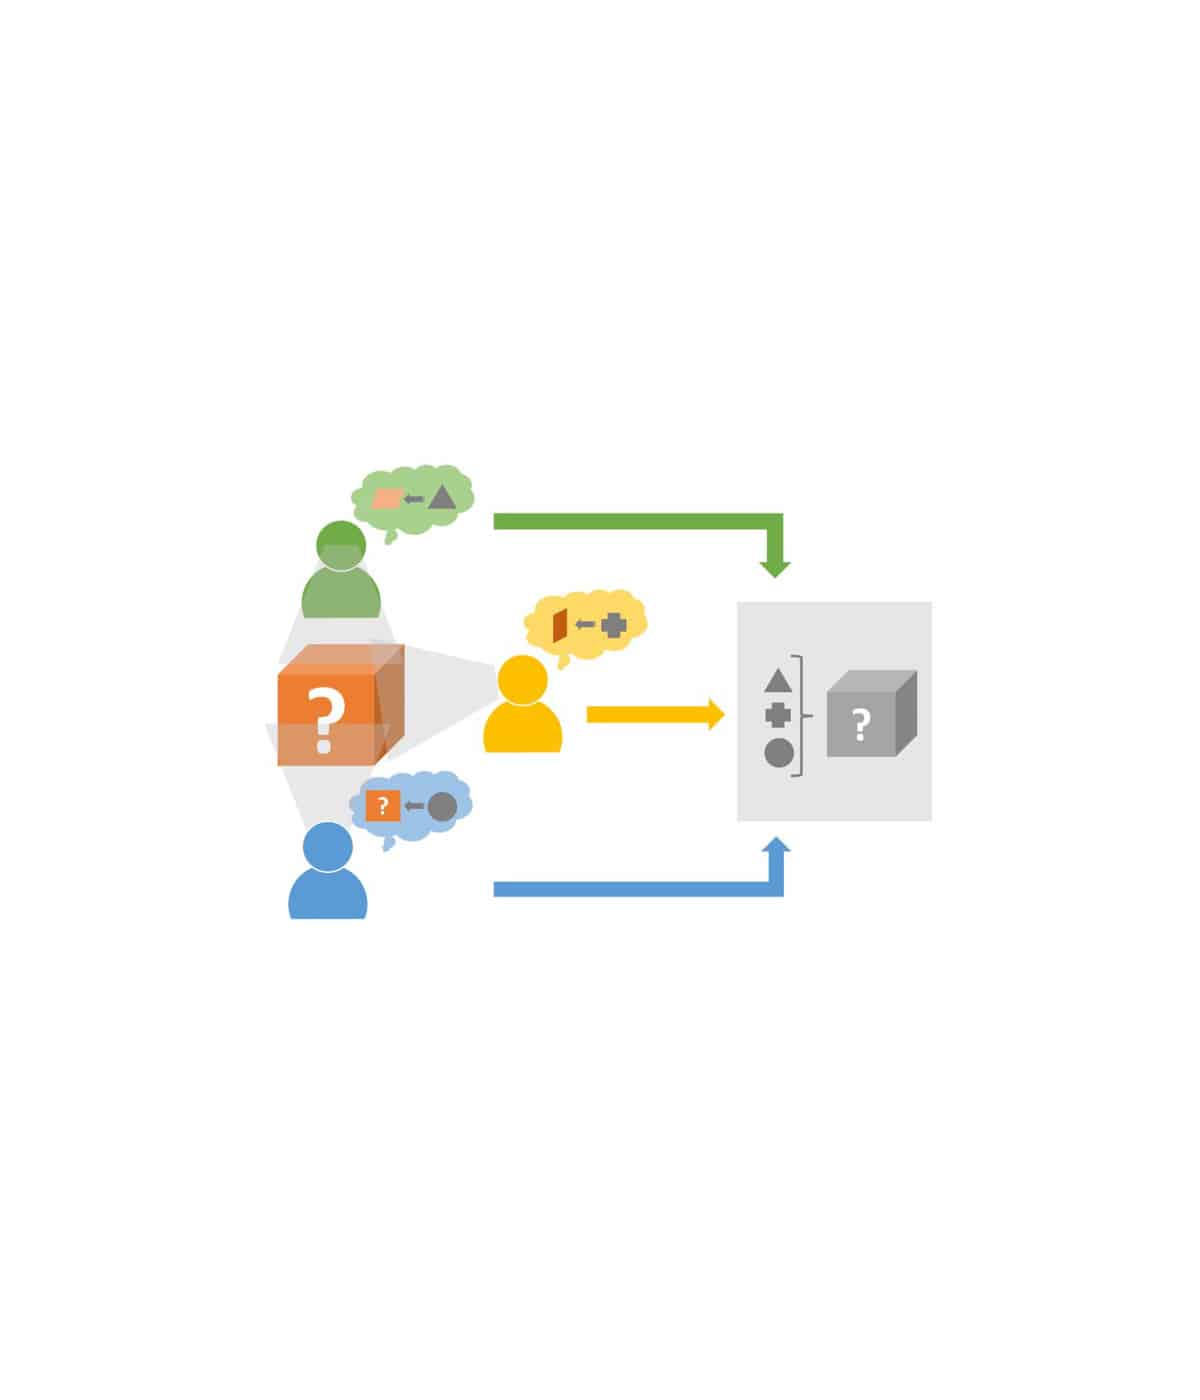
Another problem of existing spreadsheet applications is their lack of collaboration support: While business data is usually generated by a large number of users and their collaboration, this data is transferred from this collaborative environment to a desktop application for analysis purposes. The analysis in a collaborative environment could take the following aspects into account, for example: Which users design which data, functions and visualizations? Which users are responsible for the integrity of which data and functions? Which data may be read by which users? How have the structure of the spreadsheet and the values of the spreadsheet developed over time (historization)?
The project Spreadsheet 2.0 addresses the following problems of current spreadsheets:
1. Intransparency of dependencies between data, calculations and visualizations
2. Lack of support for complex data structures
3. Lack of collaboration support
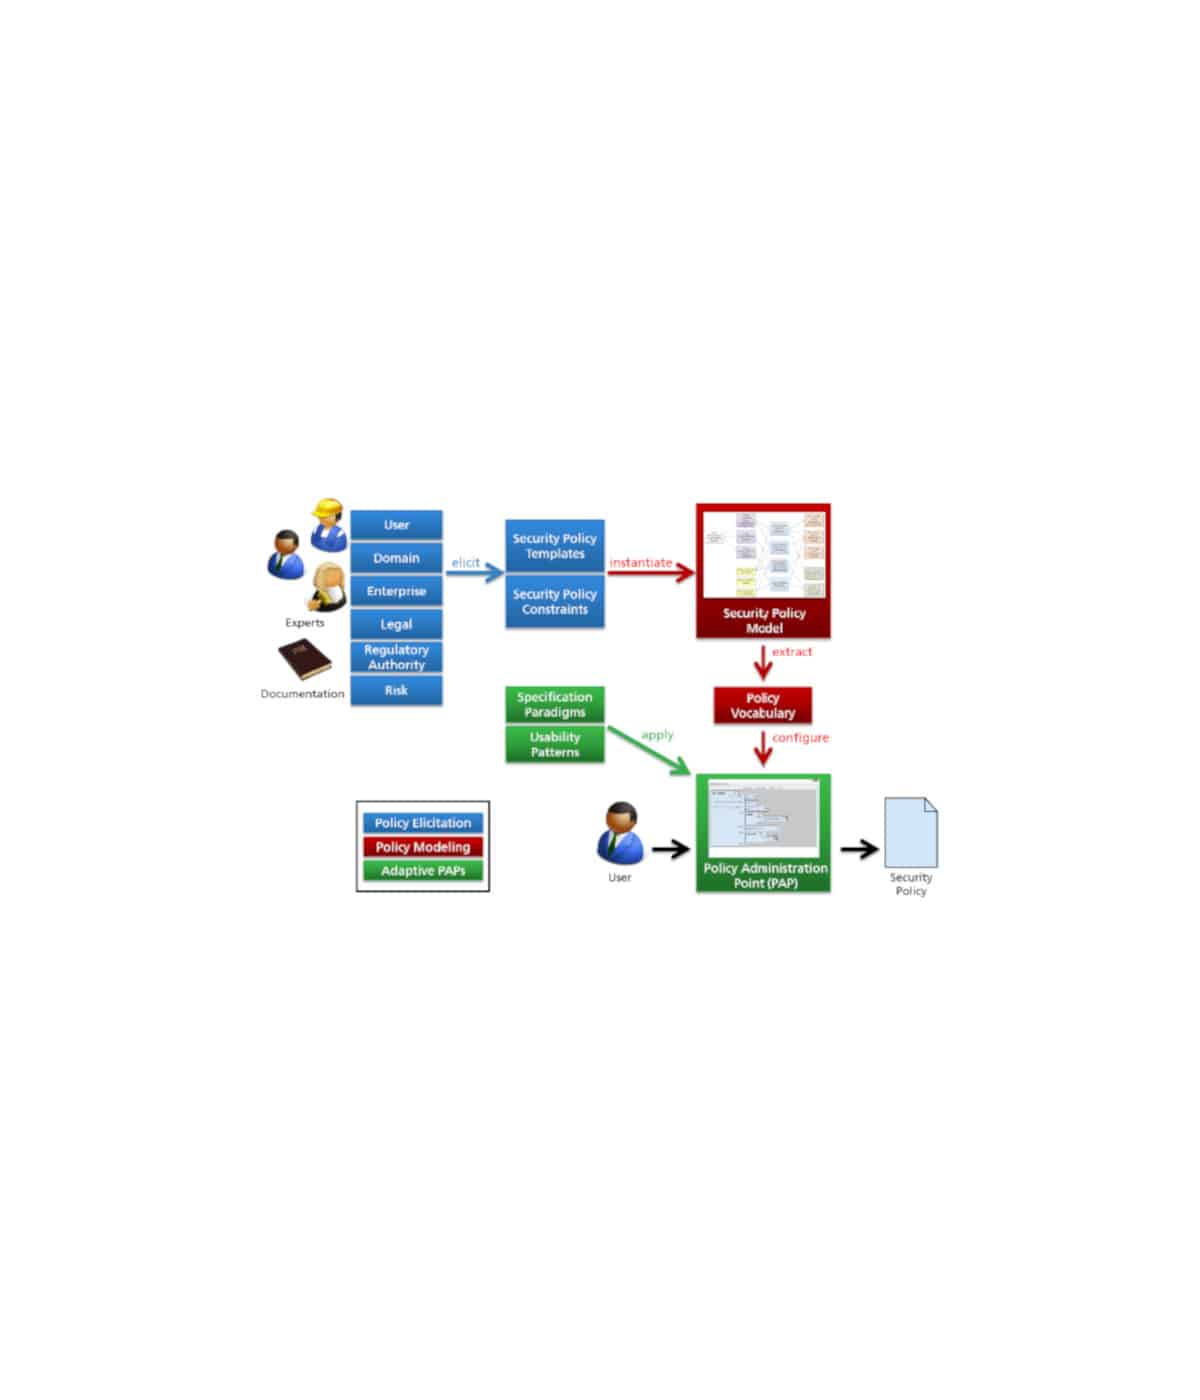
The lack of transparency in the dependencies between data, calculations, and visualizations essentially consists in the fact that a user cannot easily determine, starting from a certain cell, where the data for the calculation comes from, whether it may be overwritten, or where the results of this calculation are further used. One solution to this problem is the design of spreadsheets by modeling the “data flows” from different data sources (e.g. tables), calculation units and visualizations of the data. The user represents an additional component and influences the data flow through his authorizations, information requirements and responsibilities.
The aim of the Spreadsheet 2.0 approach is also to not only restrict the data flow between components to simple data objects (e.g. number, date, text), but also to allow the exchange of complex networked data structures (e.g. nested trees as well as network structures). Only the compatibility of two components with each other must be ensured, i.e. the output of one component must be accepted as the input of a subsequent one, regardless of the complexity of the data objects to be exchanged.
Finally, the development will take into account information from the collaborative environment when designing the spreadsheet 2.0 structure and performing the calculations. This includes the authorizations, responsibilities and information needs of the users.
Software Campus partners: TU München, Deutsche Post DHL
Implementation period: 01.03.2014 – 29.02.2016